The Dashboard Challenge and the e-commerce intelligence platform
A data visualization platform that helped CPG teams move from spreadsheets to actionable insights in minutes, enabling faster analysis and clearer decision-making.
About the Project
FROM SPREADSHEETS TO STRATEGIC INSIGHTS
Kiwiik Data is a B2B analytics platform created to help CPG brands and retailers transform scattered, manual data into clear, actionable insights across Mexico and LATAM.
I led the end-to-end product design of its dashboards, data visualizations, and decision-making workflows, creating a platform that gave teams instant visibility into performance by region, channel, product, and competitor.
DATA INTELLIGENCE FOR FASTER DECISIONS
By simplifying how users explored their data, from filters to comparisons to narrative insights, we helped commercial and marketing teams move away from static spreadsheets and towards dynamic, self-serve analysis.
This shift allowed clients to identify growth opportunities faster, monitor execution more accurately, and make better decisions without relying on analysts to prepare weekly reports.
The platform evolved into a collaborative decision tool for CPG teams across LATAM, becoming a trusted partner for operational and strategic planning.
Key outcomes
Accelerated analysis: Content Creators, Category Managers, Trade Marketing Operators, and other teams moved from manual reporting to instant insights
Improved decision-making: clearer performance views by region, brand, and product
Greater alignment: shared dashboards improved collaboration between retailers and suppliers
Problem & Opportunity
The challenge: Teams used spreadsheets and disconnected tools to manage product info, causing delays, human error, and missed market signals.
The opportunity: Build a centralized, modular platform with role-based access, real-time KPIs, and actionable alerts — tailored to each company’s e-commerce maturity.
My Role
As the Senior Product Designer, I led the product design strategy and execution from discovery to delivery, scaling the team and collaborating with product, engineering, and business stakeholders. I was responsible for research, design systems, UX/UI delivery, and feature ideation.
Key contributions:
- Scaled the design team by 50%, mentoring UX/UI designers, researchers, and copywriters.
- Designed data dashboards and complex UX flows
- Conducted 30+ user interviews and usability tests, increasing onboarding completion by 25%.
- Built a design system that reduced dev time by 30%
- Prototyped and pitched features with video demos, reducing approval time by 40%.
- Presented to stakeholders and supported the acquisition of major clients (e.g., Bimbo, Sigma).
Project Execution
Research & Insights
We interviewed 35+ users across 10+ companies: Trade Marketing Managers, Content and Data Analysts, Category Managers, and more. Methods included structured interviews, usability testing, card sorting, and heatmaps from beta users.
Key insights:
- Teams spent hours creating retailer-specific Excel files.
- Low data governance caused pricing/content errors.
- Platforms failed to alert on stock-outs or competitor changes in time.
- Teams responded too slowly to price drops or stockouts
- Content creators struggled to manually track imagery and SEO.
- Reporting processes were manual, repetitive, and slow.
These findings shaped our modular approach — companies could adopt only the tools they needed based on their digital maturity.
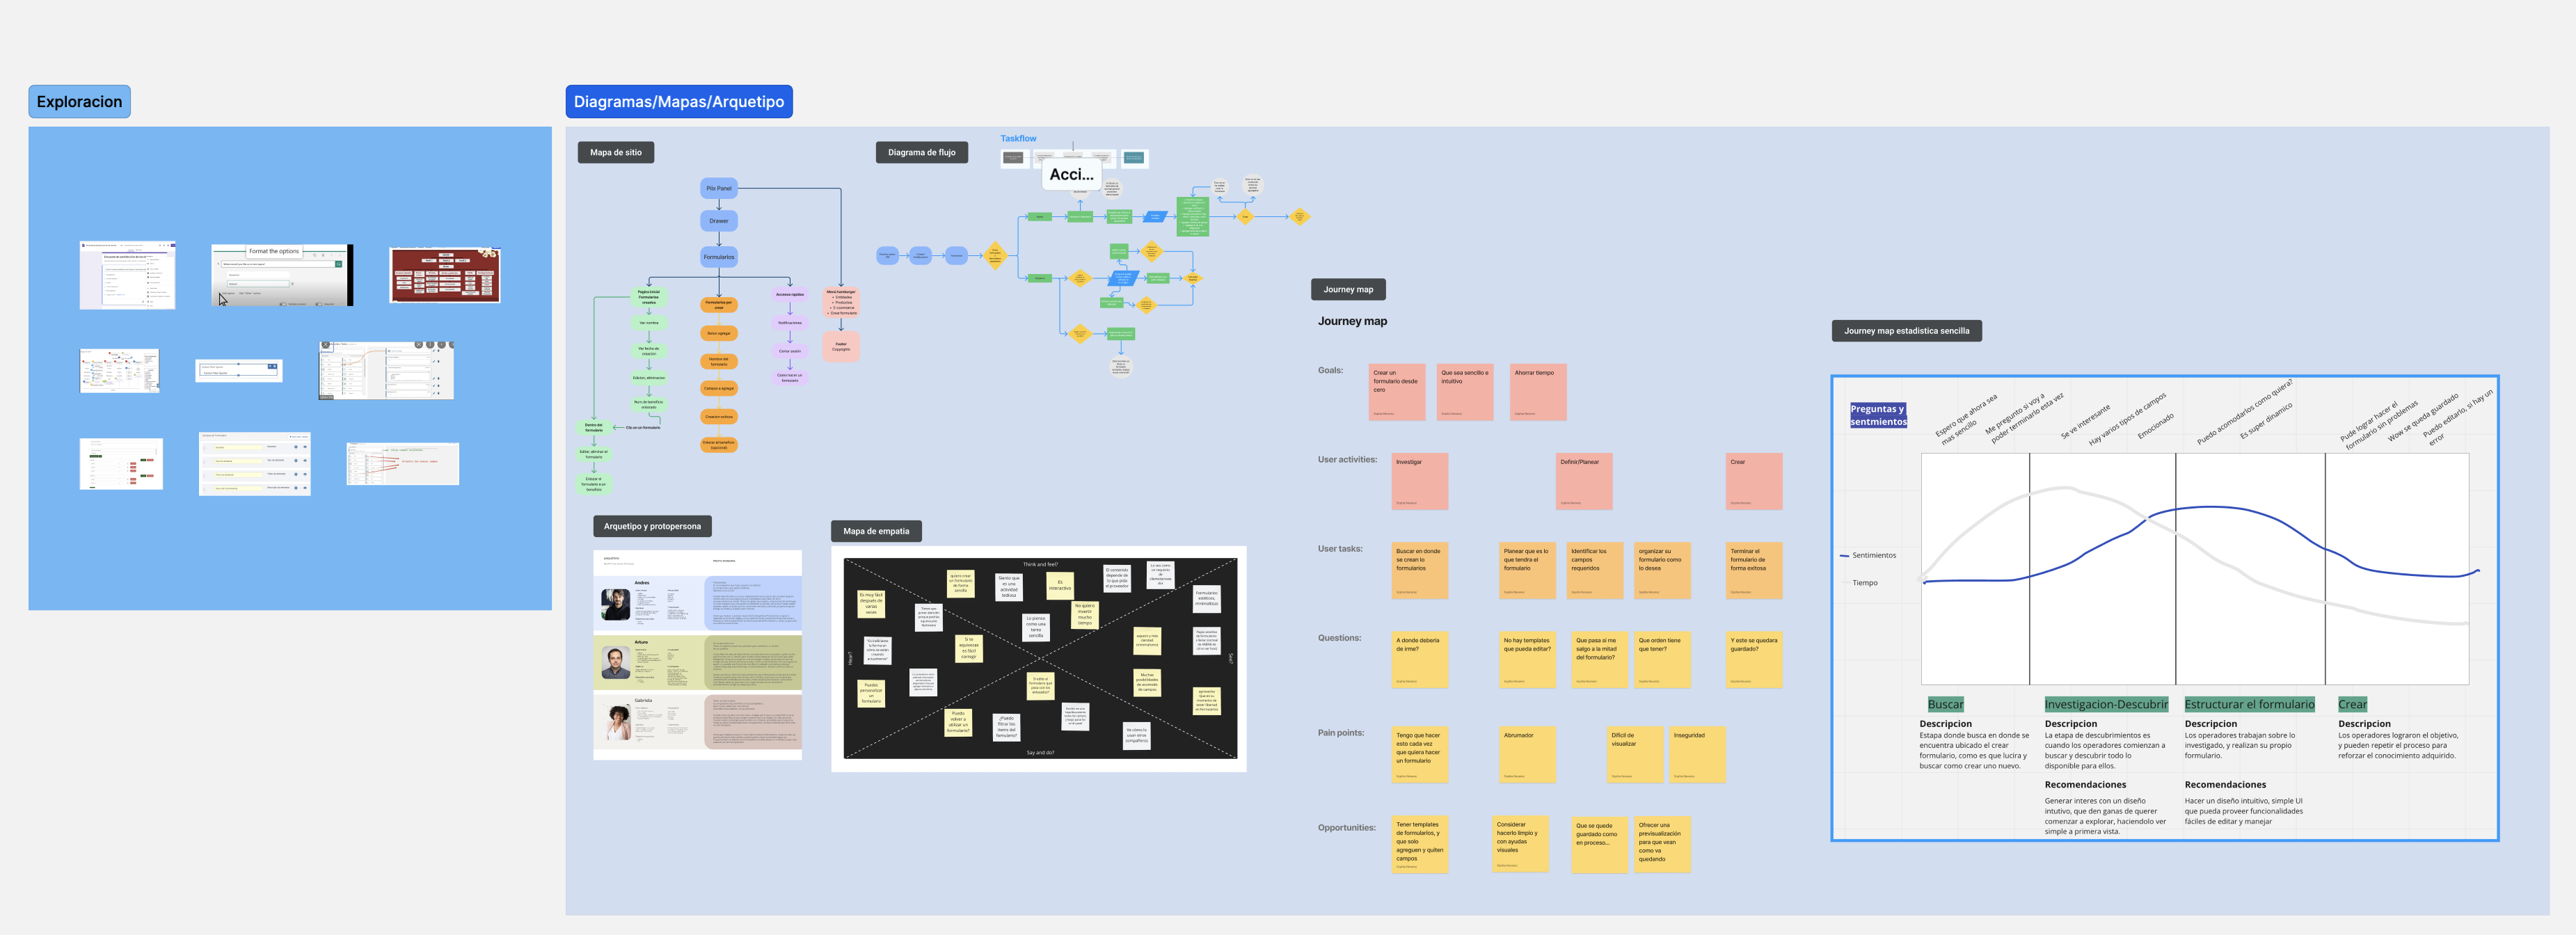
Design Process
We started each module with:
- Design Sprints
- Workshops with product and engineering
- Effort-impact prioritization tied to user pain and business goals

Iteration Workflow:
We followed an iterative design approach:
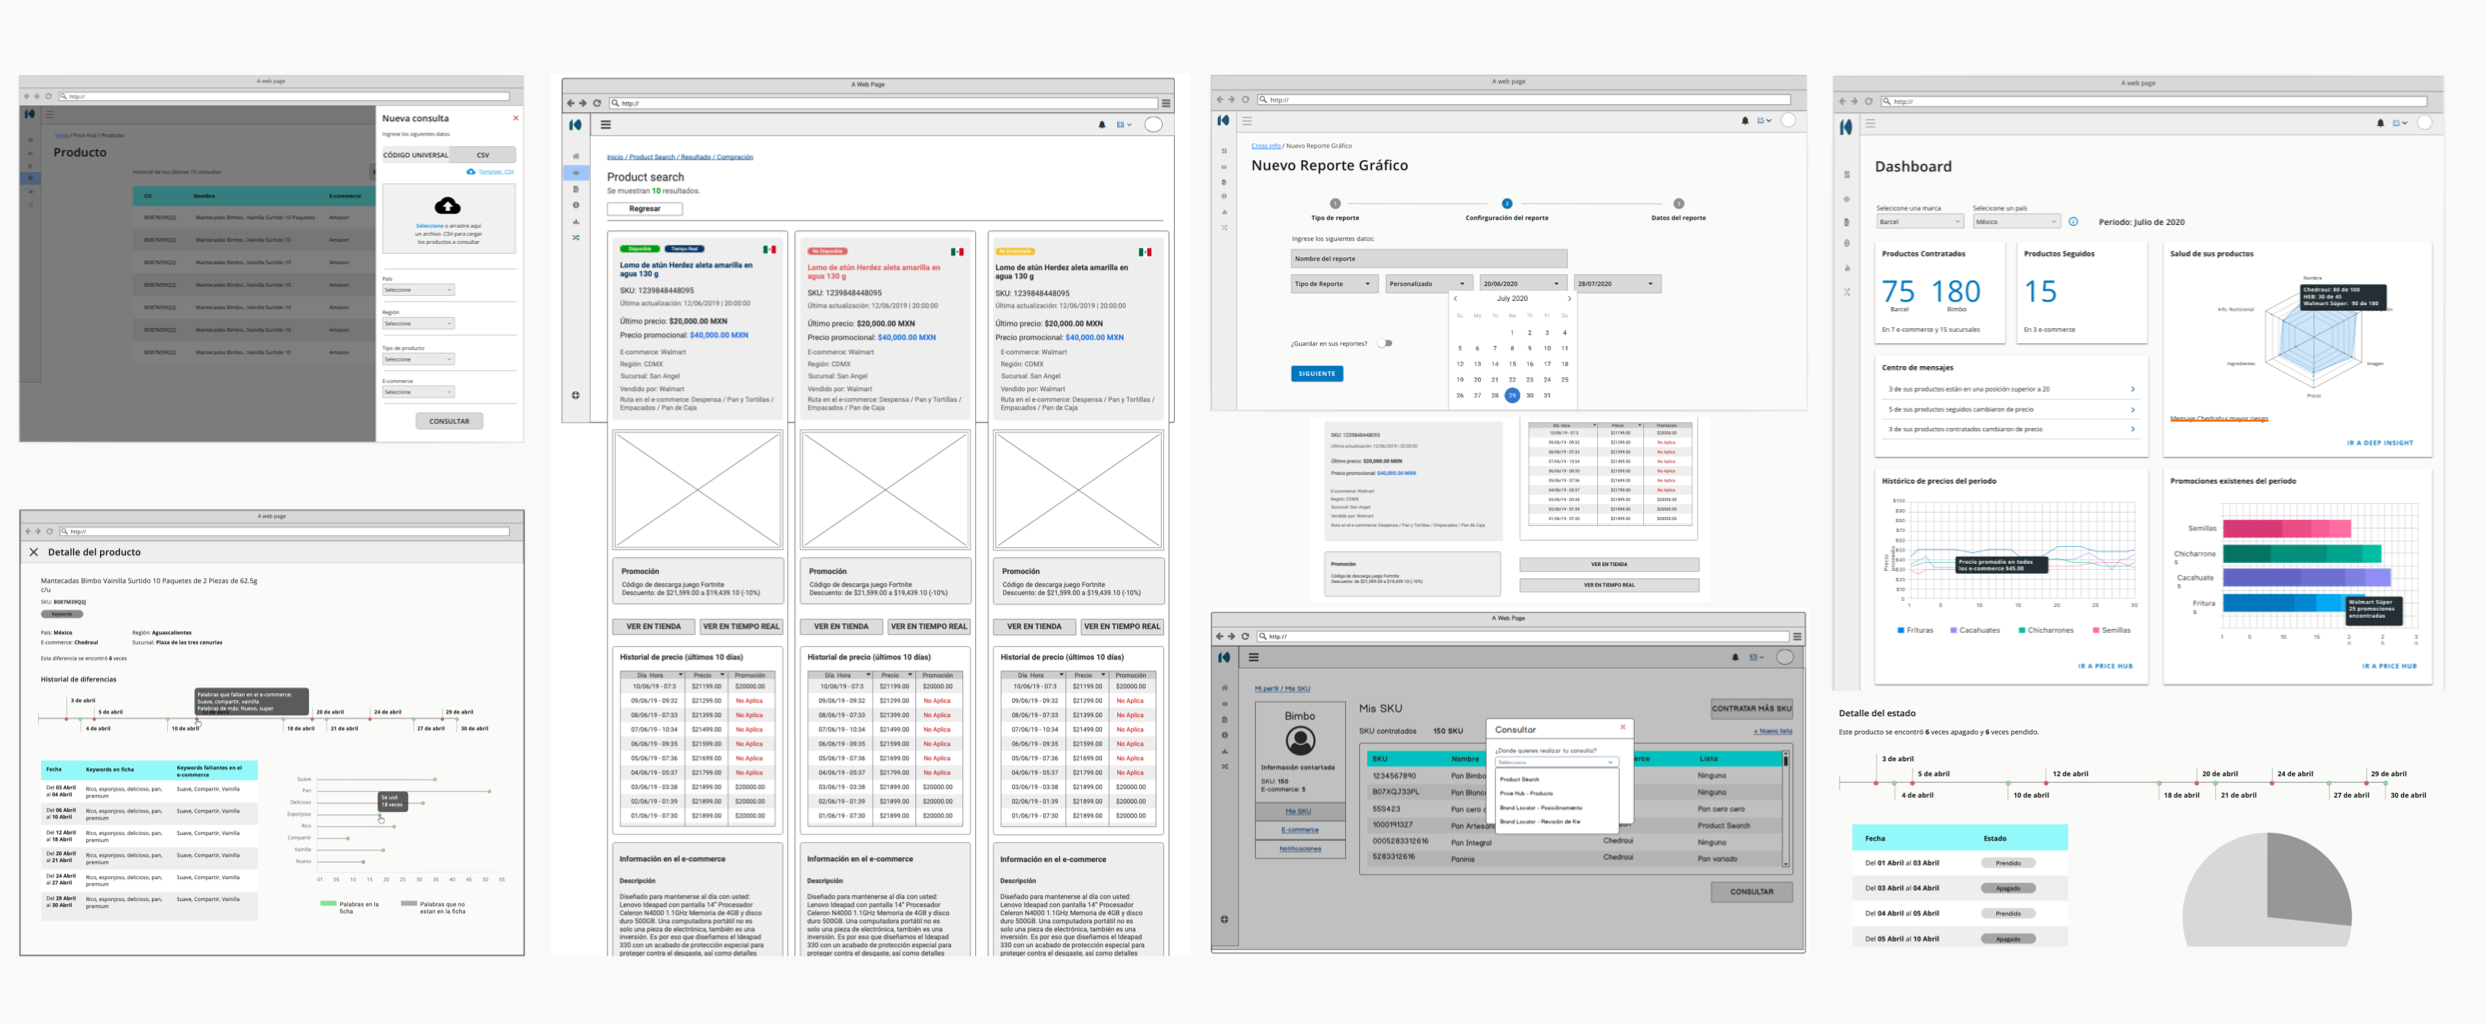
- Low- to high-fidelity prototypes in Figma
- Real-data user testing with beta clients
- Weekly stakeholder walkthroughs
- Team alignment via FigJam and Miro
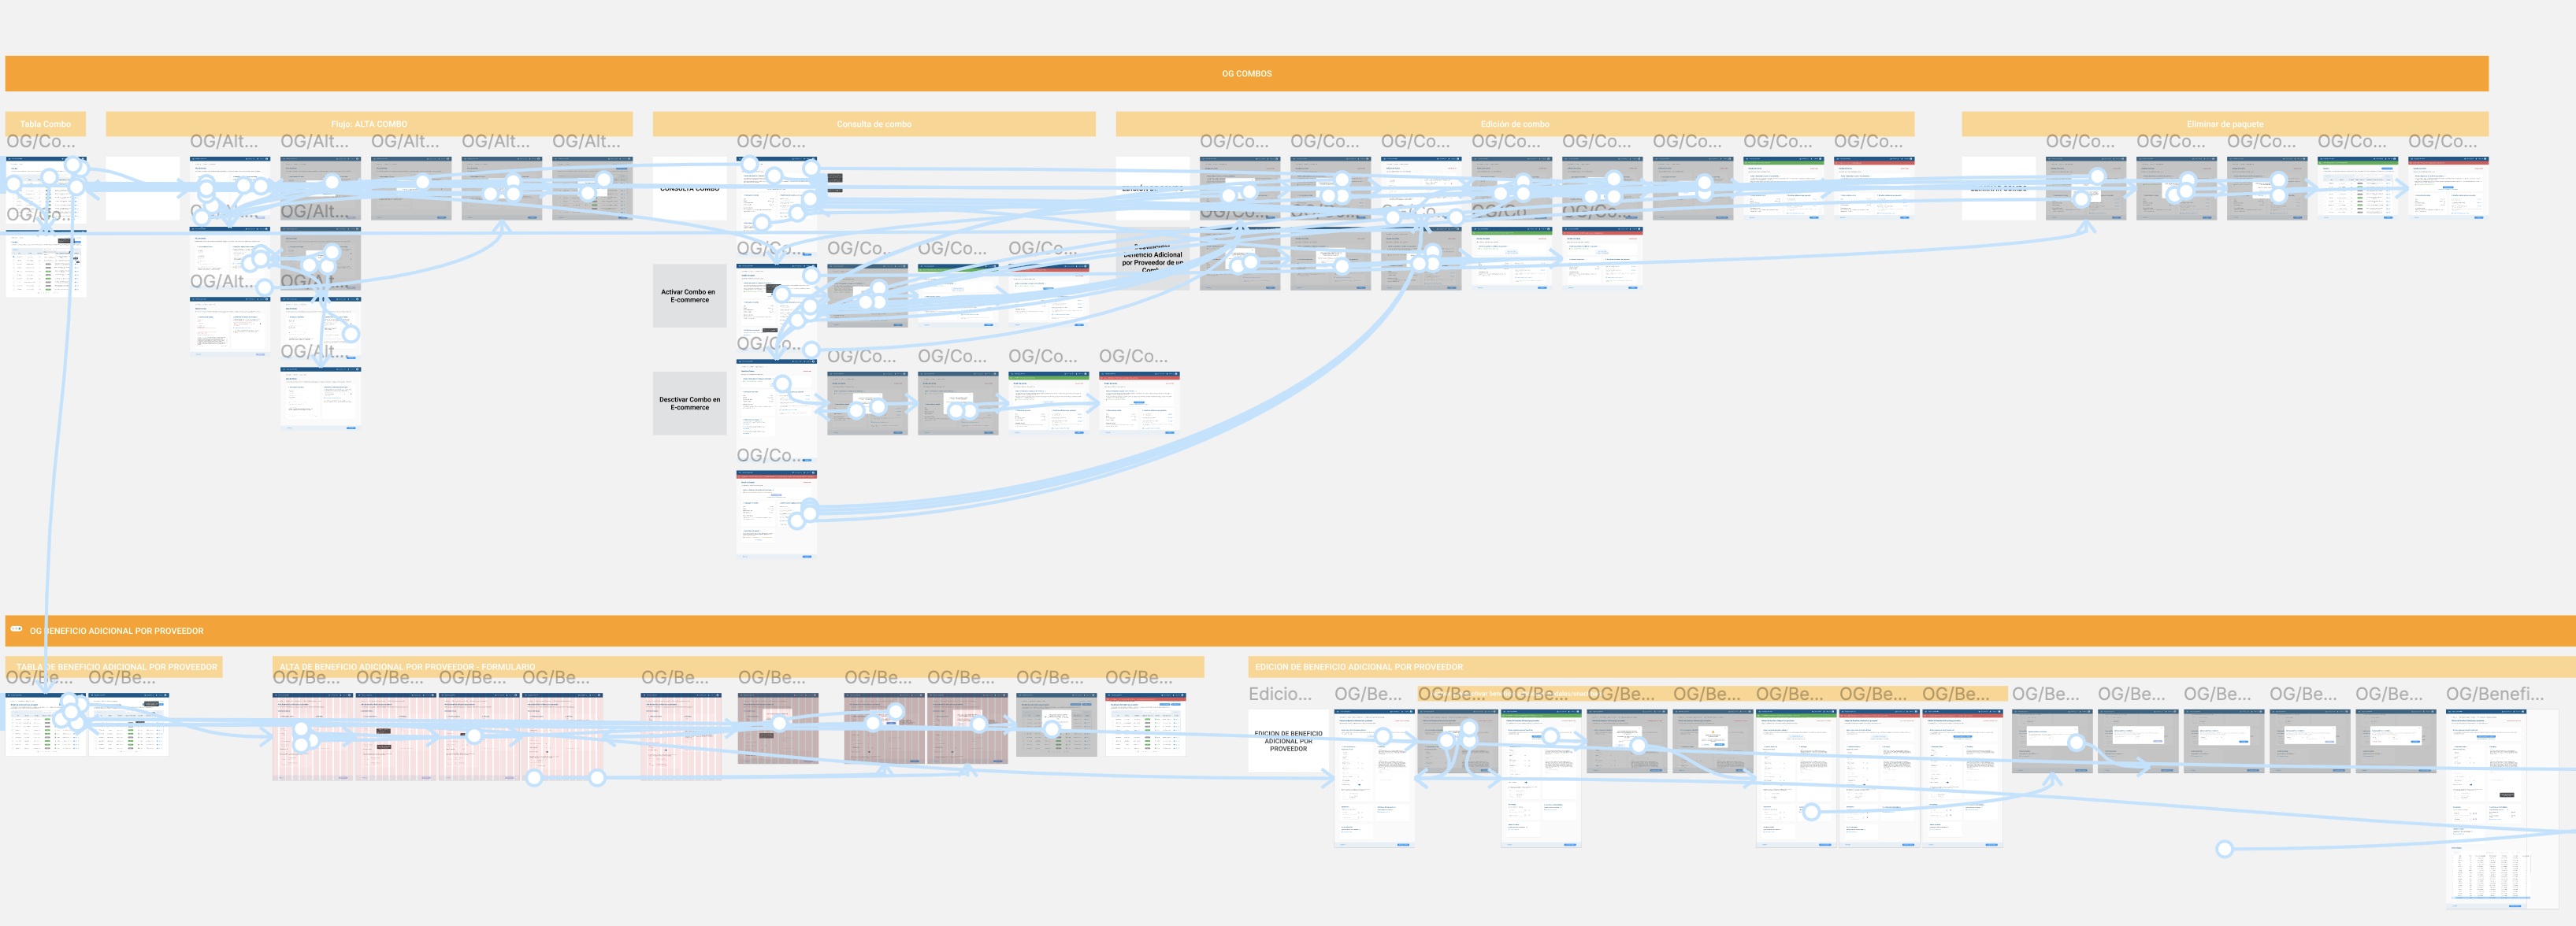
Complex UX Flows:
- Dashboards and custom reports
- Stock/pricing alerts
- Search filters
- Content scoring
- Competitor comparison
- Reporting tools
Solution & Key Features
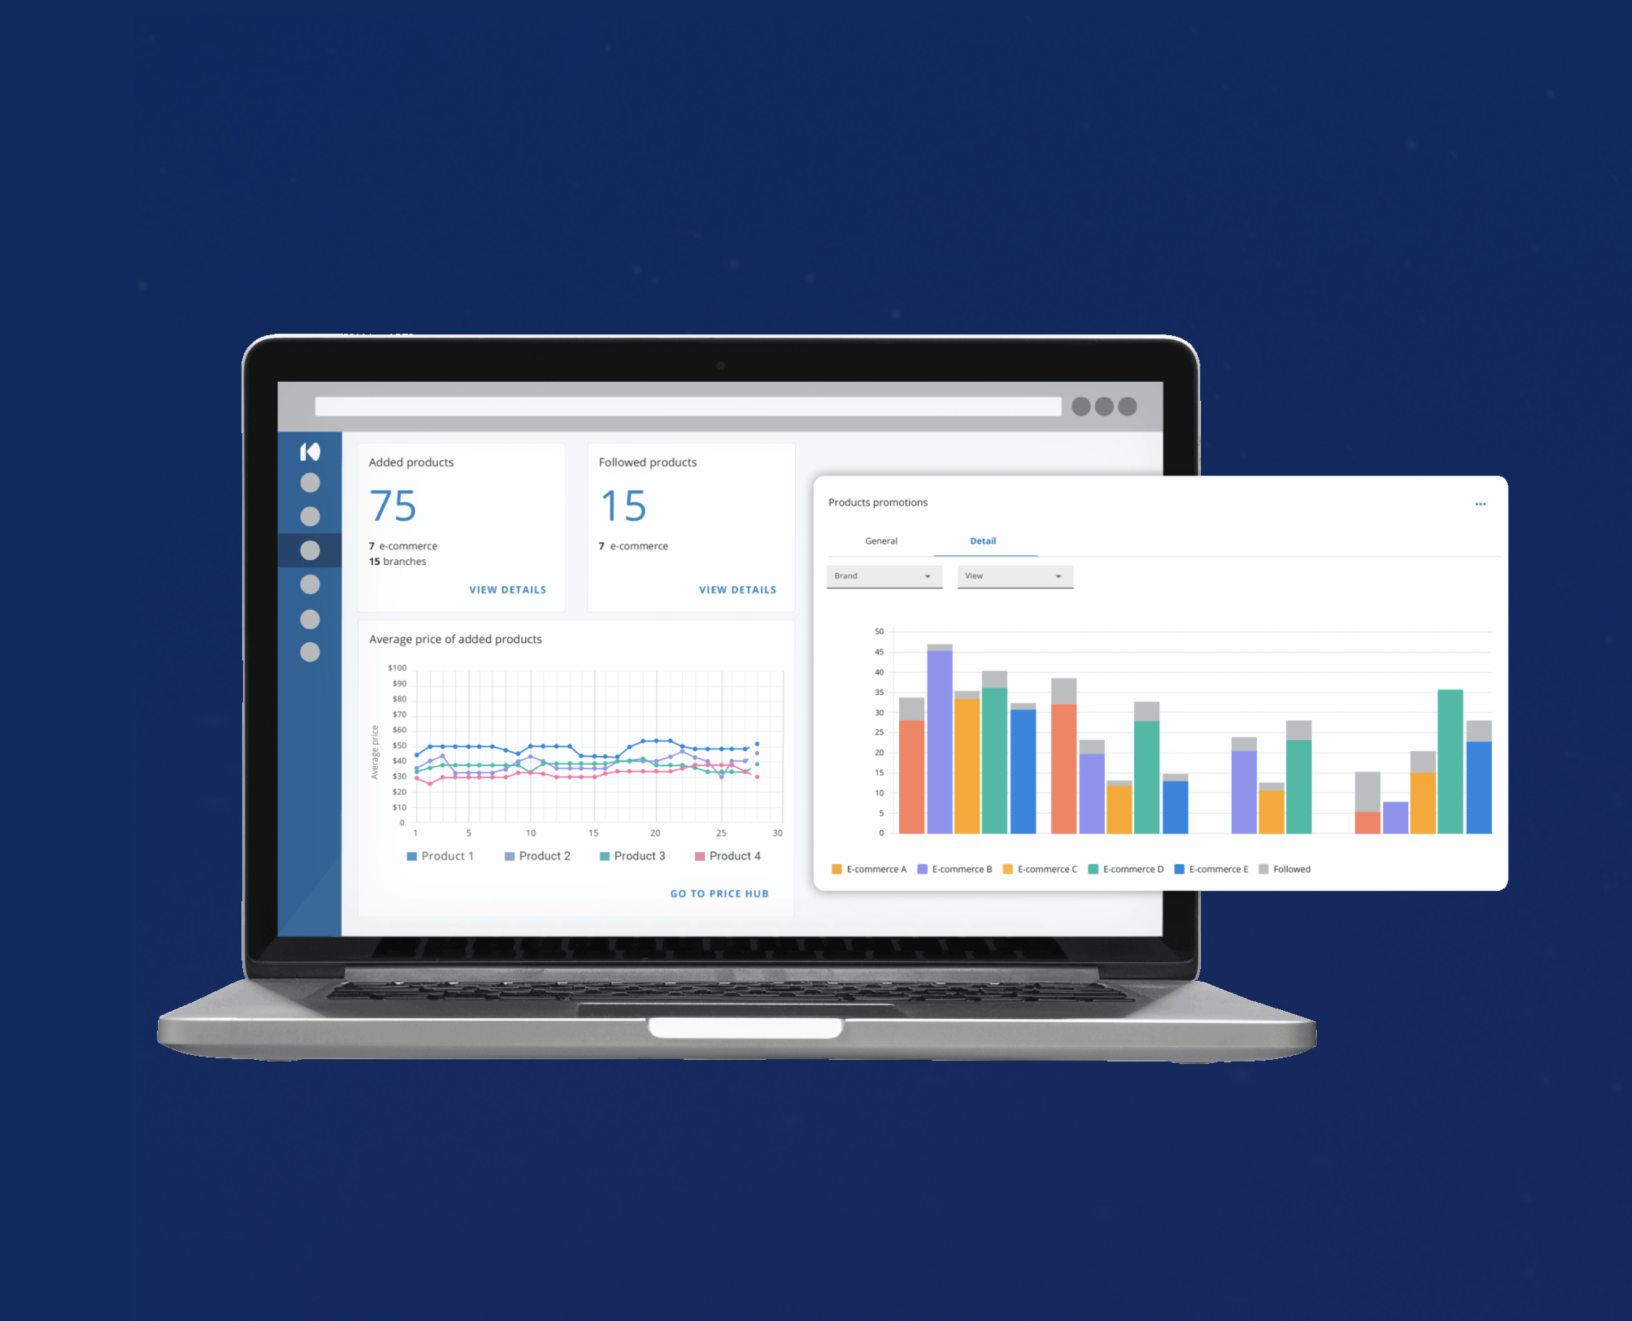
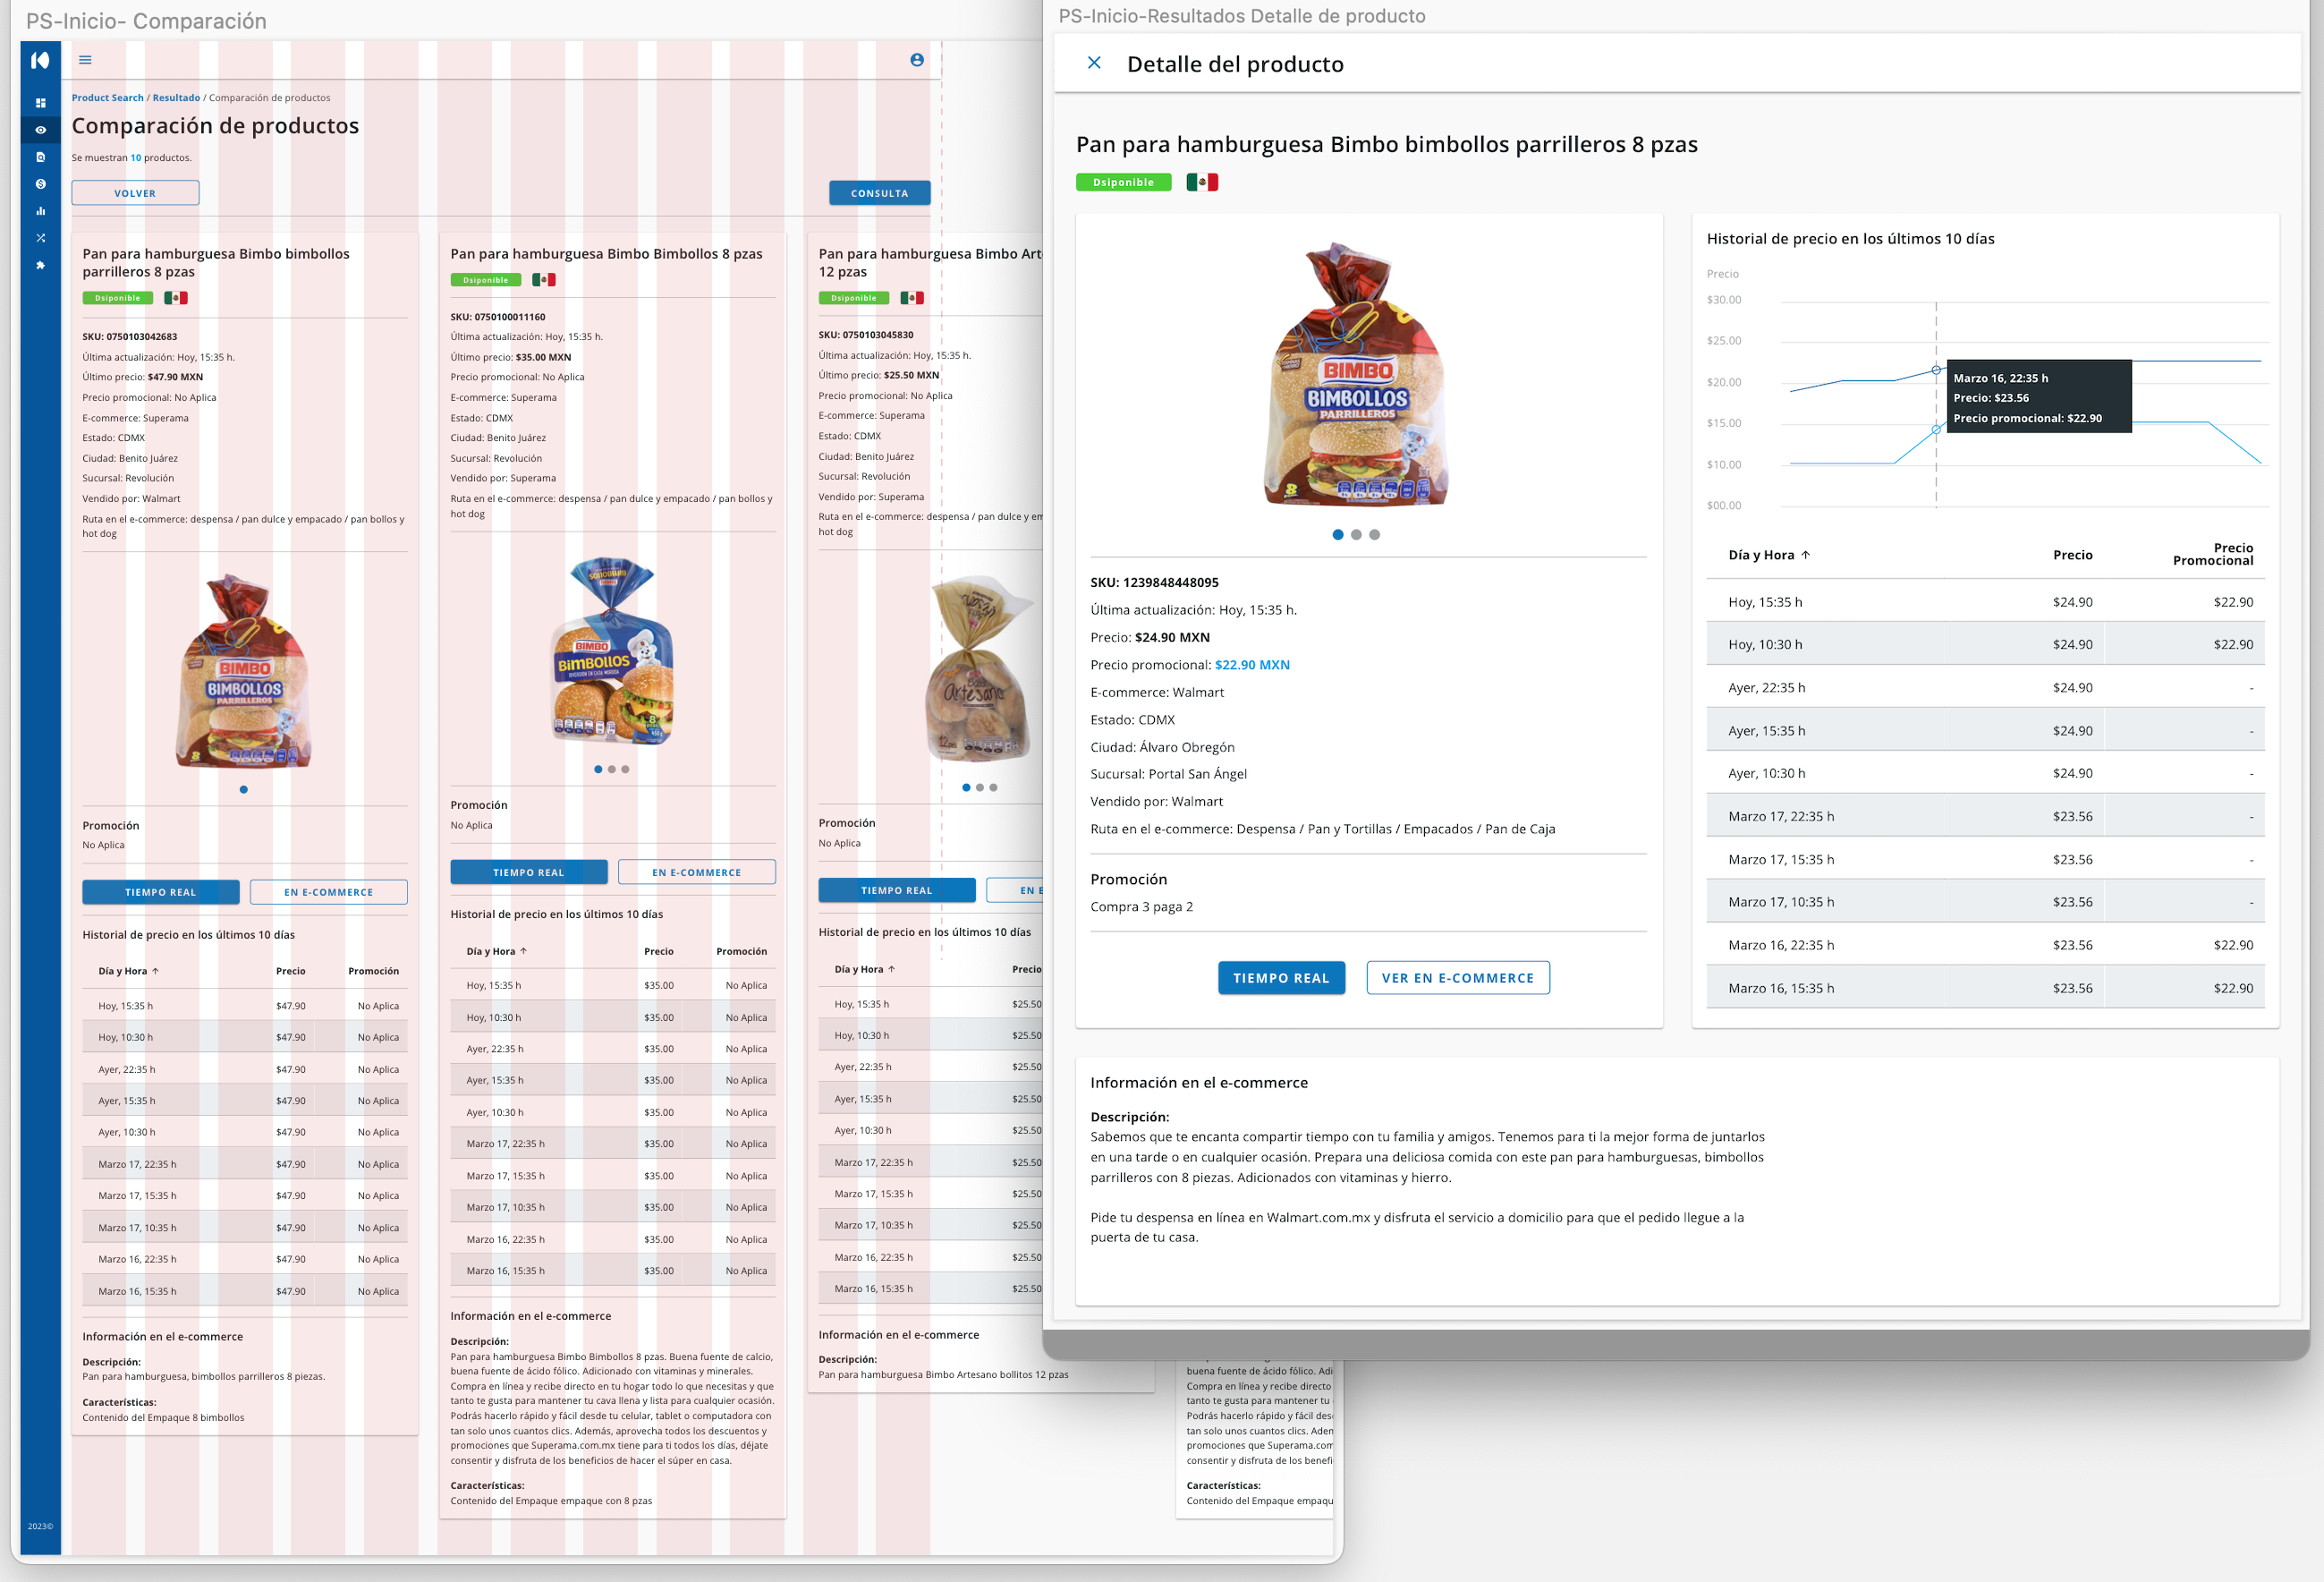
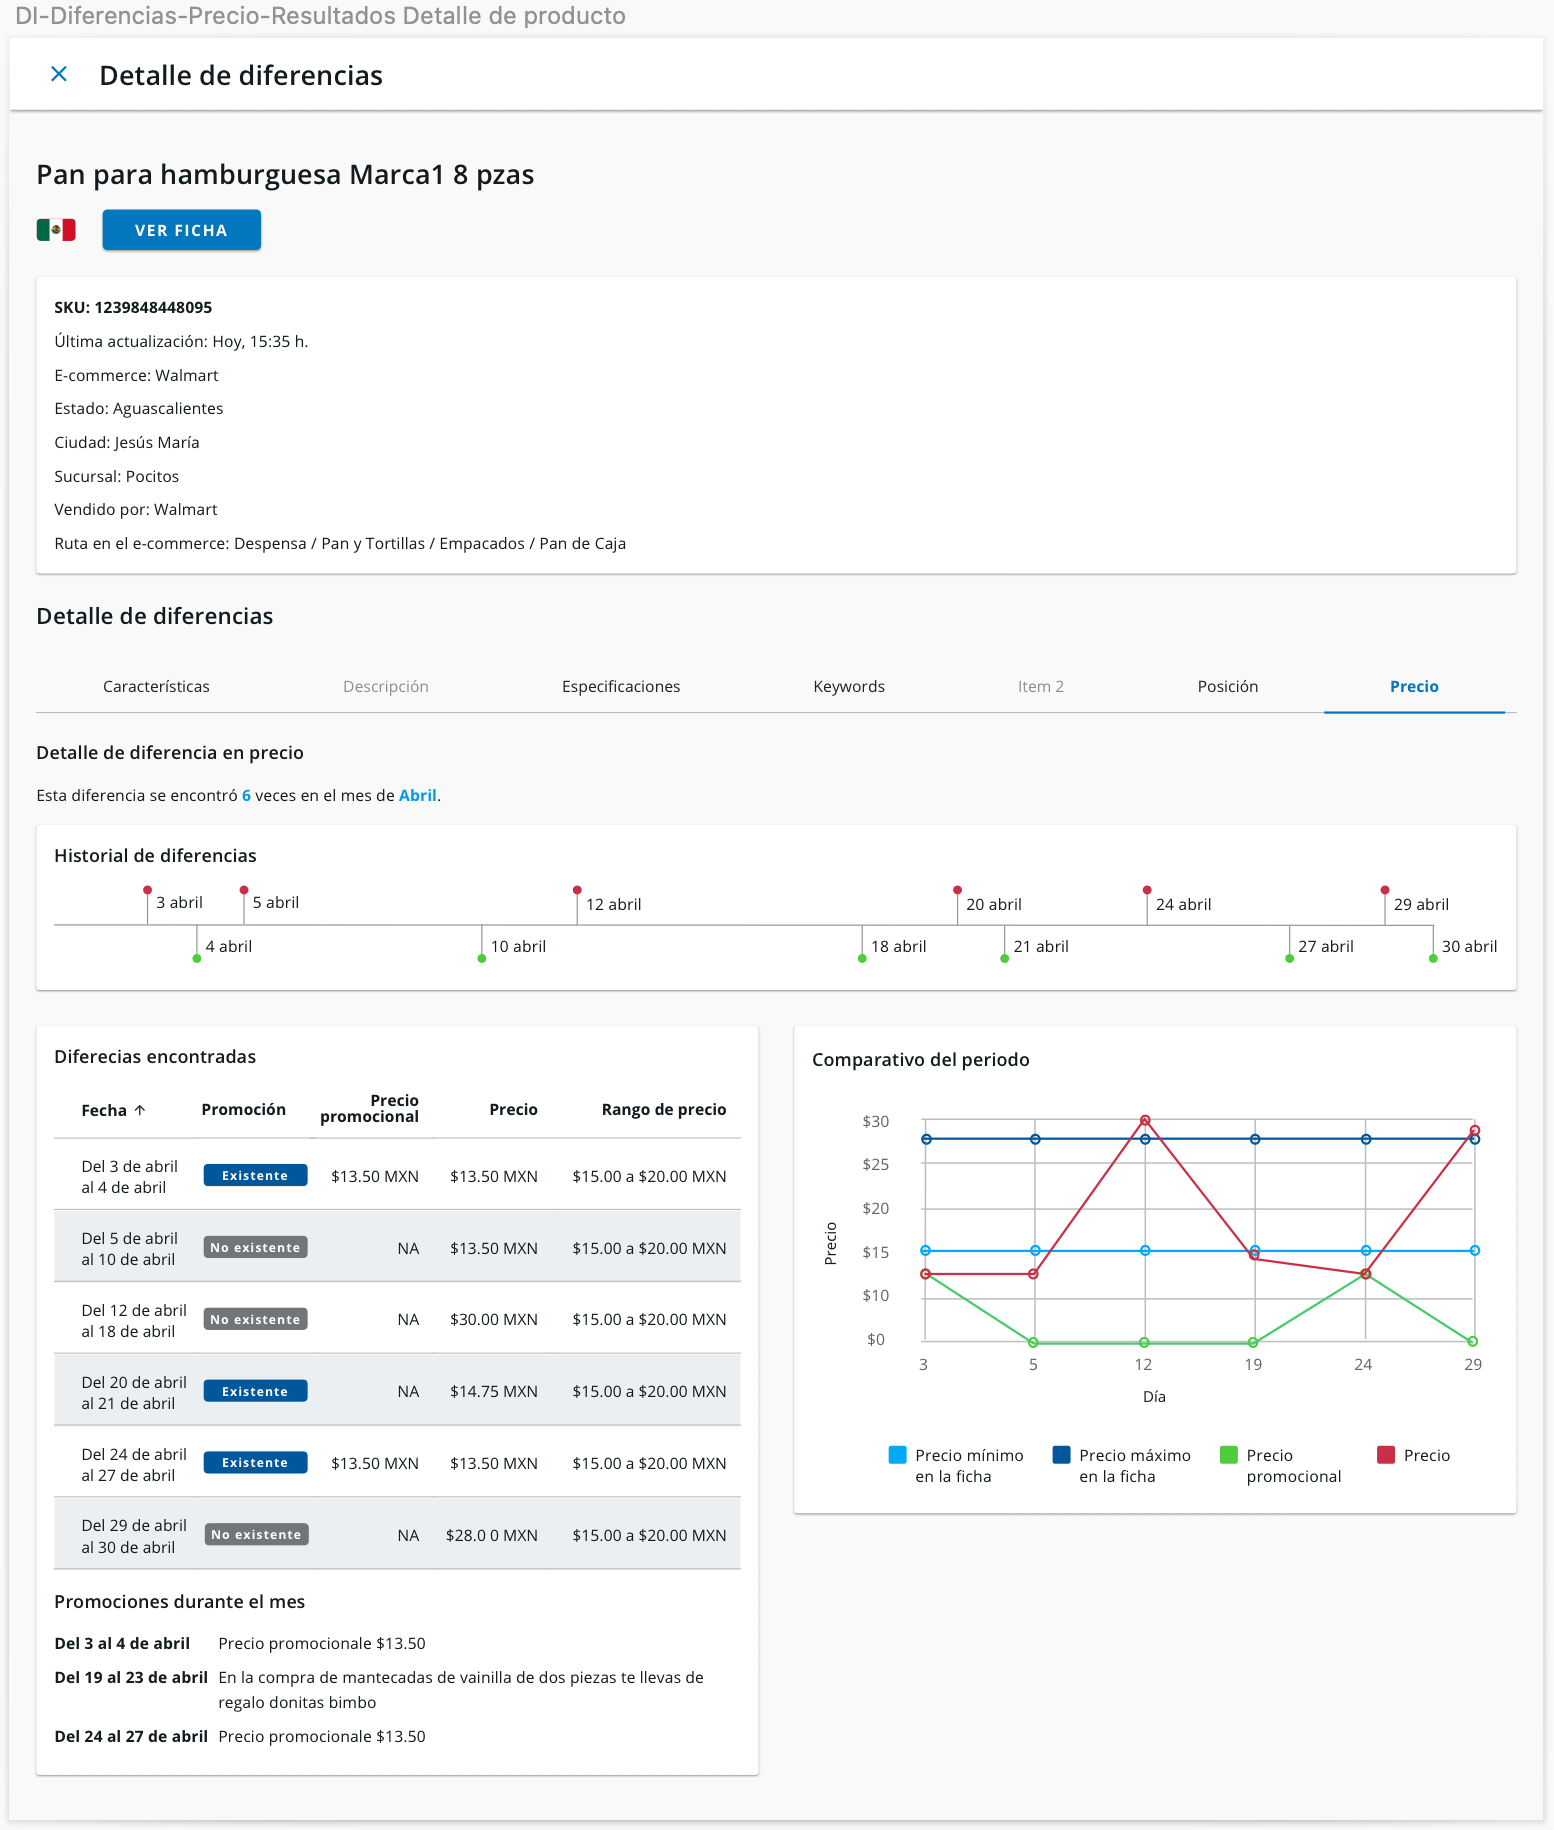
We designed a modular, scalable platform with role-based dashboards. Key features I led:
- Real-time dashboards for pricing and availability
- Content audit system with 1–5 scoring
- Automated alerts for stockouts and pricing anomalies
- Competitor price comparison across retailers
- SVG/PDF report builder with visual exports
- Advanced filters to explore product data
Testing & Iteration
We ran iterative testing cycles with:
- Usability testing (core flows)
- Beta heatmaps
- A/B tests on CTA and layout
We used real client data to improve feedback quality.
Key Outcomes:
- Reduced report creation time by 50%
- Improved dashboard clarity and feature discoverability
- Boosted user satisfaction and task success rates

Results & Impact
Product & Business:
- Launched 5 modules within 12 months
- Supported acquisition of enterprise clients: Bimbo, Sigma, Grupo AlEn
- Increased product adoption and conversion by 15%
Team & Process:
- Created design system and design/research culture
- Reduced handoff and rework through stronger collaboration
- Implemented a Design Sprint culture in the team
Reflection & Learnings
Working on Kiwiik Data was a transformational experience — both professionally and personally. It challenged me to operate at the intersection of business strategy, user advocacy, and design leadership, and it gave me the opportunity to shape a product from early concept to enterprise adoption.
Key Learnings
- Designing with data and complexity requires simplicity. Translating massive product datasets into intuitive dashboards taught me the importance of visual clarity, prioritization, and progressive disclosure.
- User research is a continuous loop, not a phase. We discovered that ongoing feedback — not just discovery-phase interviews — led to sharper, more relevant product decisions at every stage.
- Modularity improves scalability and adoption. Designing a platform where clients could adopt only the modules they needed increased flexibility and improved onboarding for users with different digital maturity levels.
- Team alignment is everything. Whether collaborating with engineers or presenting to stakeholders, clear communication and shared understanding were crucial to delivering value without friction.
This project pushed me to lead with vision while staying hands-on. I scaled the design team, improved collaboration structures, and introduced new tools and processes — all while remaining deeply involved in research, design systems, prototyping, and iteration. It sharpened my ability to balance user needs with business goals, and reinforced my passion for building products that are both strategic and human-centered.